The maps used by the British Army from 1969.
By Arnold Horner
When the Northern Ireland Troubles erupted in the late 1960s, modern methods of identifying location using GPS (Global Positioning Systems) and of electronic surveillance from drones were still largely glints in the eyes of senior superpower intelligence personnel. Much less sophisticated, and less precise, resources were available to the British Army when it was required to supplement local security forces in 1969. As personnel with little or no prior knowledge of Northern Ireland were deployed, an immediate challenge was to familiarise them with the cities, towns and countryside that were the theatre of operations.
Maps were crucial documents both for strategic planning and for the regular patrolling that became a feature in many parts of Northern Ireland for the next 30 years. Only by using maps could the soldier-outsiders plan their deployments and identify locations precisely and unambiguously. A good range of maps, at various scales and in various states of revision, were available through the Ordnance Survey of Northern Ireland (OSNI), yet it quickly became apparent that both new map series and refinements to existing maps would be needed for security purposes. Some of the innovations were quite basic, most notably the enhancement of grid lines on large-scale maps to allow locations to be more easily pinpointed, but other changes included information provided by Army HQ at Lisburn, and survey work, including air photo analysis, by the Royal Engineers to ensure that all buildings were shown and to identify ruined or unoccupied buildings. Dedicated maps were then prepared by the British Directorate of Military Surveys (DMS). As well as maintaining various map series for parts of the UK, this army unit, sometimes operating as or with a sister unit for overseas surveys, had during the 1960s produced maps for such trouble spots as Malaysia, Aden and Belize.
RELIGIOUS AREAS MAPS
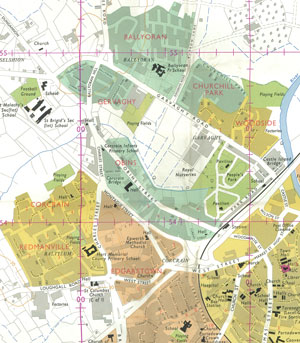
Making sense of the sectarian divisions of Northern Ireland was a particular issue in the early years and nowhere more so than in the cities, where terraces of uniformly drab housing might belie a complex and quickly changing social geography. By 1971, ‘religious areas maps’ were in use for Belfast and Derry. Described as based on information from Army HQ, these maps were presumably derived from census data. Areas deemed over 80% Protestant were shown in a brown-orange shade, whereas areas over 80% Catholic appeared in light green. More mixed areas were marked in yellow. By the mid-1970s, a religious areas map was also in use for the Craigavon district that took in the strongly polarised towns of Portadown and Lurgan (top map).
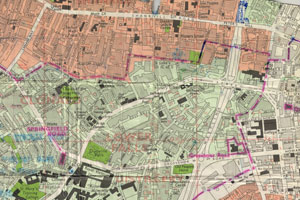
Two major purposes could be met by the religious areas maps. Being produced to a scale of 1:10,000, they allowed Belfast to be represented on just two sheets, with other areas being on just a single sheet. As such, the maps offered desk-based army intelligence a general synopsis of vital urban characteristics that could not be identified from such sources as air photographs, but they also had a particular value for operational patrols. When laminated and cut into small sections, they could be easily carried and rapidly read (map above). Streetside signifiers such as flags, murals and painted pavements might forcibly indicate a particular territory, but the map cutting could also indicate what might be anticipated ahead.
LARGE-SCALE URBAN AREA MAPS
A further, larger-scale, map series, of which there were several iterations, was at the scale of 1:2,500, a size that allowed individual buildings to be depicted. Adapted from OSNI surveys and given enhanced grids, maps on this scale covered the main urban areas and also many smaller towns—for example, at least a dozen centres in County Armagh, including places as small as Darkley, Forkhill, Silverbridge and Tynan. On versions produced in the mid-1970s and later, a notable feature is the identification of telephone call-boxes, archways, ruined roofless buildings and derelict but potentially habitable houses—locations that, from a security force perspective, might be considered as places of potential concealment where adversaries and various types of bomb or other booby-trap devices might be hidden. The extent of these buildings is especially striking on map sheets covering inner-city Belfast. Here urban blight was the culmination of several processes: wartime bomb damage, the ravages of the Troubles, plans for roads redevelopment, de-industrialisation and a still pervasive planning momentum that equated urban renewal with large-scale demolition.
RURAL AREAS
Rural areas demanded a very different scale and type of mapping. Here the hummocky drumlin topography and the bewilderingly dense field and minor road networks that define much of south and west Ulster posed particular challenges for patrolling and surveillance. As in many of the urban areas, however, uniformities in landscape could belie complexities in sectarian geography, particularly for those unversed in identifying such local signifiers as Orange halls, isolated non-conformist meeting places, small Catholic chapels and GAA pitches. As well as isolated and ruined buildings, places of concealment might include such features as woodland, hedges, roadside ditches, culverts and drains. Added to this was the challenge of recognising, and observing, an inter-state border that, with the exception of various blocked minor roads, was largely unmarked.
The maps available to navigate this unfamiliar countryside proved to be of limited value for the security agenda. Each sheet in the ‘six-inches-to-one-mile’ (1:10,560, later 1:10,000) map series covered a quite limited land area, whilst many of the sheets lacked the grid lines needed to pinpoint locations, and some had not been revised since the early decades of the twentieth century. Another map scale, the 1:25,000 series hastily created during the Second World War, was also scarcely fit for purpose, being monochrome and nearly unreadable for the densely furnished landscapes of borderland Ulster. Only the medium-scale maps, including those at the scales of 1:63,360 and 1:126,720, respectively the ‘one-inch’ and ‘half-inch’, offered greater consistency. They provided a grid and a good overview of the road network but their scale meant that they lacked the local detail needed for many area-specific security operations.
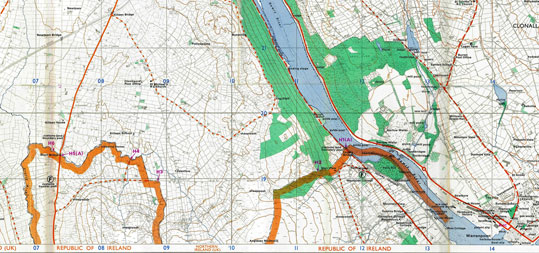
The DMS response to these issues was to create, during the early 1970s, a new map series (GSGS [Geographical Section General Staff] 5147, various editions) at the scale of 1:20,000, which covered all areas in both the Republic of Ireland and Northern Ireland that were situated along or close to the border. The new series appears to have been mainly a desk-based exercise, with several elements in its creation. Primarily it was a cobbling together, at around half their original scale, of the various six-inch sheets, but it also involved the addition of a grid aligned to the Irish Transverse Mercator Projection and some revisions (for example the addition of woodland) from recently taken air photographs. Other innovations were a more attractive general presentation with some colour, clearer typesetting of place-names and a clearer indication of the roads and contour lines that were crucial for interpreting the local topography.
Taking in an area of 11km by 17km, each map sheet also indicated the inter-state border, which was shown as a thick orange line, with the words ‘Republic of Ireland’ and ‘Northern Ireland (UK)’ in large type where the border intersected the sheet margins (Narrow Water map above). As with the medium-scale maps produced by the Ordnance Surveys in Dublin and Belfast, the map sheets did not stop at the border, thereby filling whole rectangles. As a result, significant areas of the Republic are shown, including, for example, much of north Monaghan and north Louth. Some quite considerable detail appears in parts of the Republic: for example, in the Dundalk area around 50 buildings are highlighted by generic or specific name (e.g. ‘tobacco factory’, ‘Magnet cinema’). These identifications appear to be mainly drawn from the 1937–8 Ordnance Survey of Ireland revision of the ‘six-inch’ maps for north Louth, and perhaps not from any more recent field-based intelligence. Changes relating to later periods appear to refer mainly to woodland, road classifications and the identification of closed railways.
The Ordnance Survey in Dublin experimented with a 1:20,000 map series in the 1930s, but only eight sheets, relating to Dublin and areas in the south-east, were produced. Much later (1981), a 1:20,000 map was compiled of the Glen of Imaal, Co. Wicklow, but, as far as is known, no similar maps were prepared for border areas. The 1:20,000 DMS maps therefore represent an unusual episode in Irish cartography. Interestingly, several versions appear to exist. A GSGS series, 5147B (not seen by the present writer), stored by the US Library of Congress, is recorded as having townland names and boundaries overprinted in purple on the Republic side of the border. Presumably this facilitated the pinpointing of locations either for any own-account cross-border activity or for possible operations alongside security forces in the Republic.
WELCOME TO THE REPUBLIC OF IRELAND, SIR!
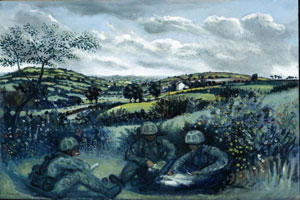
Undoubtedly the DMS 1:20,000 maps were a major addition, yet the series also had many limitations, most notably that the information depicted was of variable age and accuracy and that the relatively small scale of the maps made it difficult to read the countryside of south Ulster with confidence. The identification of the border remained a persistent issue. A painting (1997) by Captain John Wade, now in the National Army Museum, London, is entitled Welcome to the Republic of Ireland, Sir! (painting, above). It depicts a group of soldiers embedded in a small field landscape, with a map-reader who realises they are positioned beyond the border. Particularly in earlier decades, a large number of incursions into the Republic were recorded. Almost all were admittedly minor and most (but definitely not all) were apparently accidental, yet they perhaps also indicate how the difficulties of reading border area maps greatly challenged the map-reading skills of the security forces. According to Toby Harnden in his detailed appraisal of the situation in south Armagh, nearly 250 incursions took place over the period 1974–6, when the Troubles were especially intense. These included an incident in 1976 involving the arrest by gardaí of eight British SAS men, whose presence in the Republic near Omeath, Co. Louth, was allegedly explained by having used a small-scale 1:63,360 ‘one-inch’ map which offered different locational detail to the larger-scale 1:20,000 map (Sheet H2, p. 51) that might have allowed them to determine their whereabouts more precisely (Harnden 2000, 166).
In later years, British forces gave greater tactical and strategic priority to aerial and electronic surveillance of border areas. At the same time, some of the map-reading issues were alleviated with the arrival in the 1980s and early 1990s of a new medium-scale 1:50,000 map series that was ultimately developed as a joint venture by the Ordnance Surveys in Dublin and Belfast. Although its scale meant that the landscape could not be depicted in detail, this series had the merit that, unlike most of the other rural maps then in use, the maps were up-to-date and accurate. At least some of those who experienced the Troubles may have found it somewhat ironic that the collective name for these maps was to be the ‘Discovery’ series.
The present article has been constructed from the sources listed below, and from information in eBay advertisements, some library and archive catalogues, and some maps in the possession of the writer. A very much fuller story of how DMS maps were used by the British Army in Northern Ireland remains to be unravelled.
Arnold Horner formerly lectured in Geography at University College Dublin.
Further reading
- Harnden, ‘Bandit country’: the IRA and South Armagh (London, 2000).
- Hellyer & R. Oliver, Military maps: the one-inch series of Great Britain and Ireland (London, 2004).
- Horner, ‘A note on military mapping for engaging with the Northern Ireland Troubles’, Irish Geography 54 (2021), 141–55.
- Taylor, Air war Northern Ireland: Britain’s air arms and the ‘bandit country’ of south Armagh, Operation Banner 1969–2007 (Barnsley, 2018).